


Every app owner needs to constantly work on adjusting processes and testing new opportunities to succeed. In this guide you will find three main directions to focus on. We collected practical advice on how to get your app to the next level while keeping positive economics using Apphud.
Get insights from accurate data
Before strategy implementation, you have to know your existing results: product and user acquisition benchmarks. Accurate app revenue analytics is the basis of business growth. There is a permanent process of goal setting and achieving.
Apphud provides the most accurate app revenue tracking on the market. Our team worked hard to let you make data-driven decisions based on reliable data. We have reached 99.9% of data matching between Apphud and App Stores on the majority of connected apps.
Let’s go deep into the practice and learn which metrics you should track and how you can use them to generate revenue.
Free Trials
Most mobile apps with subscription models successfully use free trials for customer engagement.
Following trial events will be helpful for your growth strategy:
- Trial started
- Trial canceled
- Trial converted
 Trial Conversion Chart, Apphud
The market benchmark of trial conversion is around 25-30%. In the post-IDFA world a trial event became a lifeline for marketers for attracting new users and estimating results from different sources.
Guide
Integrate Apphud with Atrribution Partners
1. Integrate Apphud with one of the following MMPs: Branch, AppsFlyer or Adjust. This will allow you to get user-level attribution data for consented users.
2. Integrate Apphud with Apple Search Ads. This will allow you to get attribution data for all users. Analyze your subscriptions revenue in Apphud Charts across marketing campaigns.
3. Analyze marketing campaigns in your MMP dashboard enriched by Apphud's subscription events.
Guide
Optimize marketing campaigns on the users' cohort who didn’t cancel the free trial after 1 hour.
For implementation follow 4 steps:
1. Whenever a user starts a free trial and launches the mobile app again while the trial is still active after 1 hour, consider sending an increased conversion value to SKAdNetwork. Use Apphud SDK to check the auto-renewal status of the subscription.
2. Map these custom events with one of the Ad Network's standard events.
2. Launch a marketing campaign with optimization on these events.
4. Analyze revenue results in Apphud Charts and in MMP dashboard for marketing campaign effectiveness analysis.
Subscriptions
It might be obvious but you should know all about your subscriptions: the number of new subscribers, renewals, the average subscription check, cancellations, and so on.
These numbers reveal the bottlenecks of your app and give you a hint for launching the next experiments. For example, let’s take a look at the Subscribers retention cohort in Apphud.
The chart’s X-axis is labeled as “Renewals 0-N”. It stands for the Nth renewal of a user subscription. Subscriptions may have lapses. So during the billing grace period the subscription remains active.
 Subscribers retention cohort, Apphud
Cohort analysis is a crucial source for gathering product hypotheses. It is a great tool for a deep understanding of how well subscriptions are renewed and how revenue is retained.
The point is in segmentation because the overview picture couldn’t be so insightful. Apphud provides 20+ filters for user segmentation: by Country, Device, Product, Rule, Promo Offer, Gender, Age, Marketing channel, etc.
Guide
Analyze your data with Cohorts Charts.
What to do:
1. Segment your users in the Subscribers retention cohort by product, country or other parameters.
2. Pick the period of the users’ first seen date.
3. View by Week, Month, Quarter, or Year based on your subscription length.
4. Look at the average lifetime for this cohort.
Revenue
The reason why you are reading this guide is to search for revenue growth opportunities. The events we mentioned above are important, but you have an incomplete picture if you do not take into account revenue metrics. There are a bunch of different metrics but not all of them are equally useful for the monetization strategy. We chose the main ones to calculate unit economics and find app growth points.
This metric displays monthly recurring proceeds, it helps you better understand how much money you have from recurring purchases each month.
Looks pretty straightforward, but it has a trick. Your future decisions depend on how you calculate proceeds. To measure worldwide proceeds correctly you have to consider VAT rates and internal Apple conversion rates.
Just for the record, Apphud deducts Taxes from the Proceeds metric for iOS and Android apps. Without it data discrepancies can reach 15%. It’s hard to make the right decisions based on this kind of unreliable data, isn’t it?
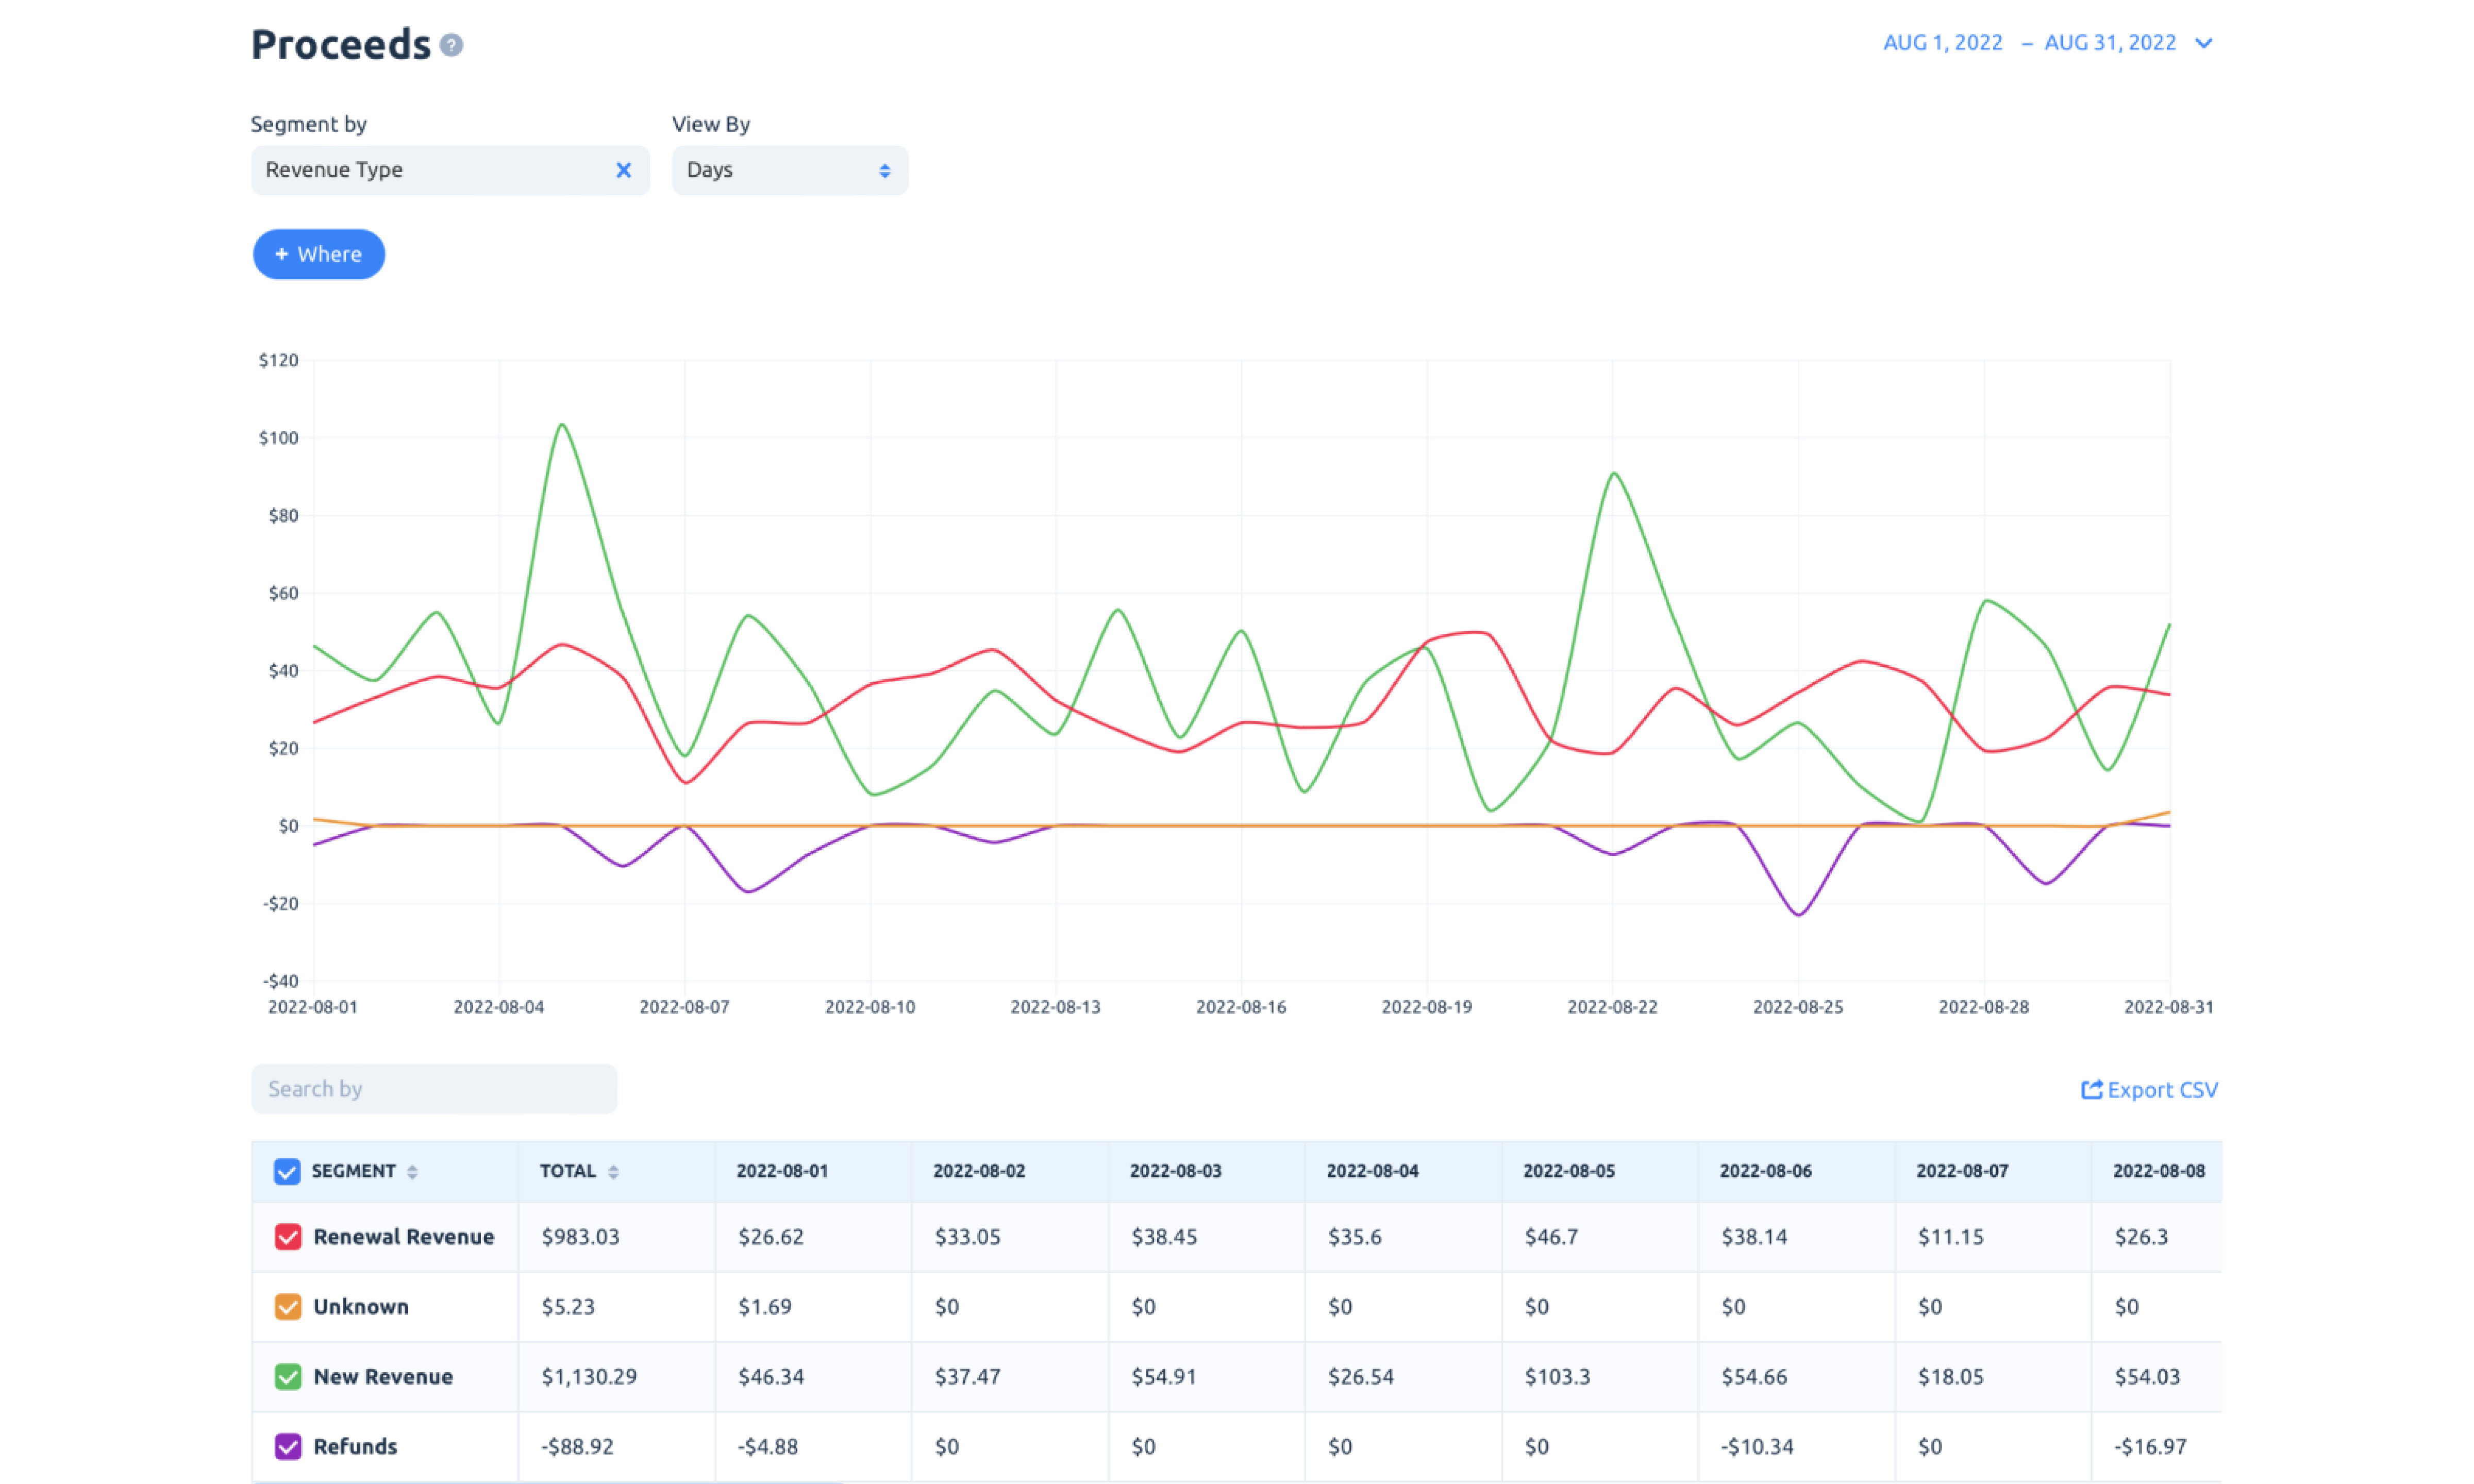 Revenue chart segmented by revenue type, Apphud
- Churned revenue
Besides getting new revenue, app owners always face losing subscribers. We can’t avoid it but we can control and impact it. To calculate this metric you need to choose a period first. It shows how much revenue was lost during the selected period.
The “Revenue Churn” chart is especially helpful to ensure that you're not losing the most valuable customers (subscription churn can be relatively low while churned revenue is high).
Like subscriptions churn, revenue churn also can be negative if users upgrade subscriptions or subscribe more within your app. And, of course, it's a good signal too.
- ARPXX (Average Revenue Per smth)
Everyone related to the subscription business at least heard about ARPU (Average Revenue Per User) and ARPPU (Average Revenue Per Paying User) metrics. These metrics allow you to predict whether you can reach monthly revenue targets. And if not, what exactly do you need to adjust? It calculates the revenue, detects channels that successfully target your audience, and can even target people similar to your existing customers.
However, we want to emphasize new alternative metrics. You can track the average revenue per event that better matches your final goal. For instance, ARPAS (Average Revenue Per Activated Subscriber).
The ARPAS metric is necessary to optimize campaigns on users who did valuable actions in the app. The need for measuring this metric is dictated by SKAdNetwork attribution restrictions.
Keep in mind that a better way to analyze this data is a cohort analysis. You will be able to measure the value of any user group you attracted from user acquisition channels.
Guide
Measure the ARPAS metric to control your Cost per Action
What to do:
1. Go to the Apphud ARPPU chart and select Calculate users by events - Purchases + Trial started.
2. Segment by product, country or other paratemer.
3. Choose the maximum cohort period.
4. View the ARPAS value.
5. Run marketing campaign and send the same conversion value to any of actions: free trial, subscribe, or non-renewing purchase.
6. Keep your CPA lower than ARPAS metric by setting a bid that is equal to ARPAS.
General app analytics approach
- Analyze cohorts to measure and compare different user groups in detail in terms of time.
- Keep track of the dynamics of users’ accumulative revenue starting from Day 0.
- Find new insightful metrics that will help you to survive in the post-IDFA world.
- Know your benchmarks by tracking main conversions for the most valuable cohorts.
- Understand the structure of subscription revenue: new, retention, recurring, refunds, etc.
Data becomes insightful when you analyze it in detail, immerse it into numbers and transform it into a hypothesis in order to move to the next level - running experiments.
Launch A/B/С tests
The first contact with a paywall is decisive for transforming a user into a customer. You may not have a second chance. It means that you should find the most profitable products, prices, and paywall designs to maximize app revenue.
You can find inspiration for your paywalls designs in the Apphud Paywall Gallery. We collected more than 150 free downloadable paywalls and screen trends to make the testing process easier for app owners.
The powerful A/B experiments tool will help you to find the most converting paywall:
- Up to 5 paywalls and pricing variations simultaneously.
- Custom JSON config for each variation, for example, to modify your UI.
- Variation name and experiment name can be retrieved from SDK.
- Base variation (aka variation A) is editable.
- Custom traffic allocation for each variation.
- Custom audience, for example, targeted for a specific country, app version, or other filters.
While creating the experiment you can set up a bunch of parameters: variations, audience, and platform. You can run several experiments on the paywall simultaneously by choosing a different audience for each test. In case of overlapping audiences, such users will be marked to the first experiment only, the earliest by its creation date.
The experiment overview page shows all the main metrics: Views, Marked Users, Affected Users, Trials, CR Trials, CR Trial-Purchase, Purchases, CR Purchases, Last Purchase, Sales, Proceeds, Refunds, ARPU, ARPPU.
We provide you with a statistically valid result which is a number between 0 and 1. It is used to determine whether the experiment result is random. For our experiments, we define a significance threshold of 5% (or P-value = 0.05).
Statistically significant in this case is the result whose P-Value is equal to the significance level or less than it (P-value ≤ 0.05).
When we assure the result of the test is significant in terms of P-value, we display it.
 Experiments section, Apphud
Guide
Increase your conversion rates with the best-performing paywall.
What to do:
1. Describe your experiment: choose the audience, define paywall variable parameters, set estimated metrics and expected result.
2. Search for industry paywall best practices in the Apphud Paywall Gallery.
3. Design up to 5 options.
4. Launch experiment using Apphud.
5. Get a statistically valid result.
Note that the more variants you have in your running experiment, the more users will be required to see a significant result.
Set up push campaigns
When we attract new customers our main goal is to retain them. The best way to do this is to use push notifications.
Apphud may win back lapsed subscribers, reduce churn rate, attract non-paying users, and get cancellation insights using a powerful automation tool called Rules. The Rules are a combination of automated push notifications with no-code in-app interactions like surveys and discount offerings that serve to engage and re-engage subscribers. This tool is easy-to-use and provided by a web editor with zero lines of code.
What you can do with Apphud Rules:
- Create and schedule marketing campaigns dedicated to holidays, like Christmas.
- Launch marketing push campaigns manually with just a button click.
- Interact with your subscribers based on their subscription event, e.g. trial canceled, trial converted, subscription refunded, etc.
- Collect feedback from users when they cancel their subscriptions.
- Add up to 24 hours of delay to the event-triggered Rule.
- Interact with your free users based on their behavior. For example, send a push notification prompting them to finish the payment.
- Create recurring push notification campaigns to engage your free users.
- Analyze your Rule performance in any of our charts:
ARPU, Proceeds, Cohorts, etc.
Build a new Rule from scratch or use one of the templates.
 Rules templates, Apphud
Guide
Increase your monthly app revenue by up to 10% by automatically offering a discount to a user at the specified moment.
What to do:
1. Add App Store Server Notifications URL to your app settings in App Store Connect.
2. Configure Push notifications.
3. Create a rule from a template called "Win Back Lost Subscribers"
4. Set the trigger: Subscription Canceled Or Trial Canceled
5. Choose the execution time - Immediately or After delay (max 24 hours)
6. Create an offer screen using our online editor
7. Offer a discount with the relevant message.
Other use cases for push notifications you can find in our blog post.
Conclusion - understand your data to grow
The ultimate objective of each app owner is to attract users who will pay off and bring profit. We showed that before you start taking action, you need to go deep into analytics and define hypotheses. This is the first step, without which experiments and flows will not work as expected. Conduct constant research, gather user feedback, and measure your performance. All this will make your product better, and in turn, more desirable for users.
In this guide, we considered 3 pieces of advice for subscription-based apps: analyze your data, launch experiments, and retain customers with push notifications. With Apphud you can accomplish all of that. Apphud is a revenue data platform that reveals app growth points. Let’s grow your app revenue together. Sign up for free and try it out!


