


Description
ARPPU is an essential metric if you want to track your app growth, understand your target audience, and, most importantly, increase revenue. ARPPU indicates Average Revenue per Paying User and calculates with the following formula:
ARPPU = (Total Revenue* generated by users in period) / # number of paying users
*In this formula, revenue could mean Sales or Proceeds. It's better to calculate ARPPU based on the Proceeds metric to analyze more accurate values.
However, it’s not as simple as it seems.
While analyzing ARPPU, keep in mind that you need to specify the timeline because subscribed users may have different subscriptions: users upgrade, reactivate and downgrade them.
Where to get insights while analyzing ARPPU for the Nth day:
- Check the average revenue growth dynamics in the first days after the payment (purchases after onboarding, conversion from the trial).
- Search for "peaks" of revenue by week/month/year (for example, annual subscription renewals).
- Compare different cohorts by period, country, source, offers, etc.
- Calculate when new users will pay off by comparing growth dynamics in different cohorts.
In Apphud, we calculate ARPPU for cohorts and for each user personally, starting from the date of the first launch and then in 24-hour intervals. Thus, each user has their life cycle calculated from the first application launch.
How to do it with Apphud
In Apphud, we provide you with all the necessary data for the deepest revenue analysis.
Let’s take a look at the ARPPU chart in Apphud.
- Segment this cohort by
Country by IP - Choose to calculate with
Proceeds - Choose a
Purchaseevent - Filtered the date
- Compare the cohort period of
7 daysand180 days
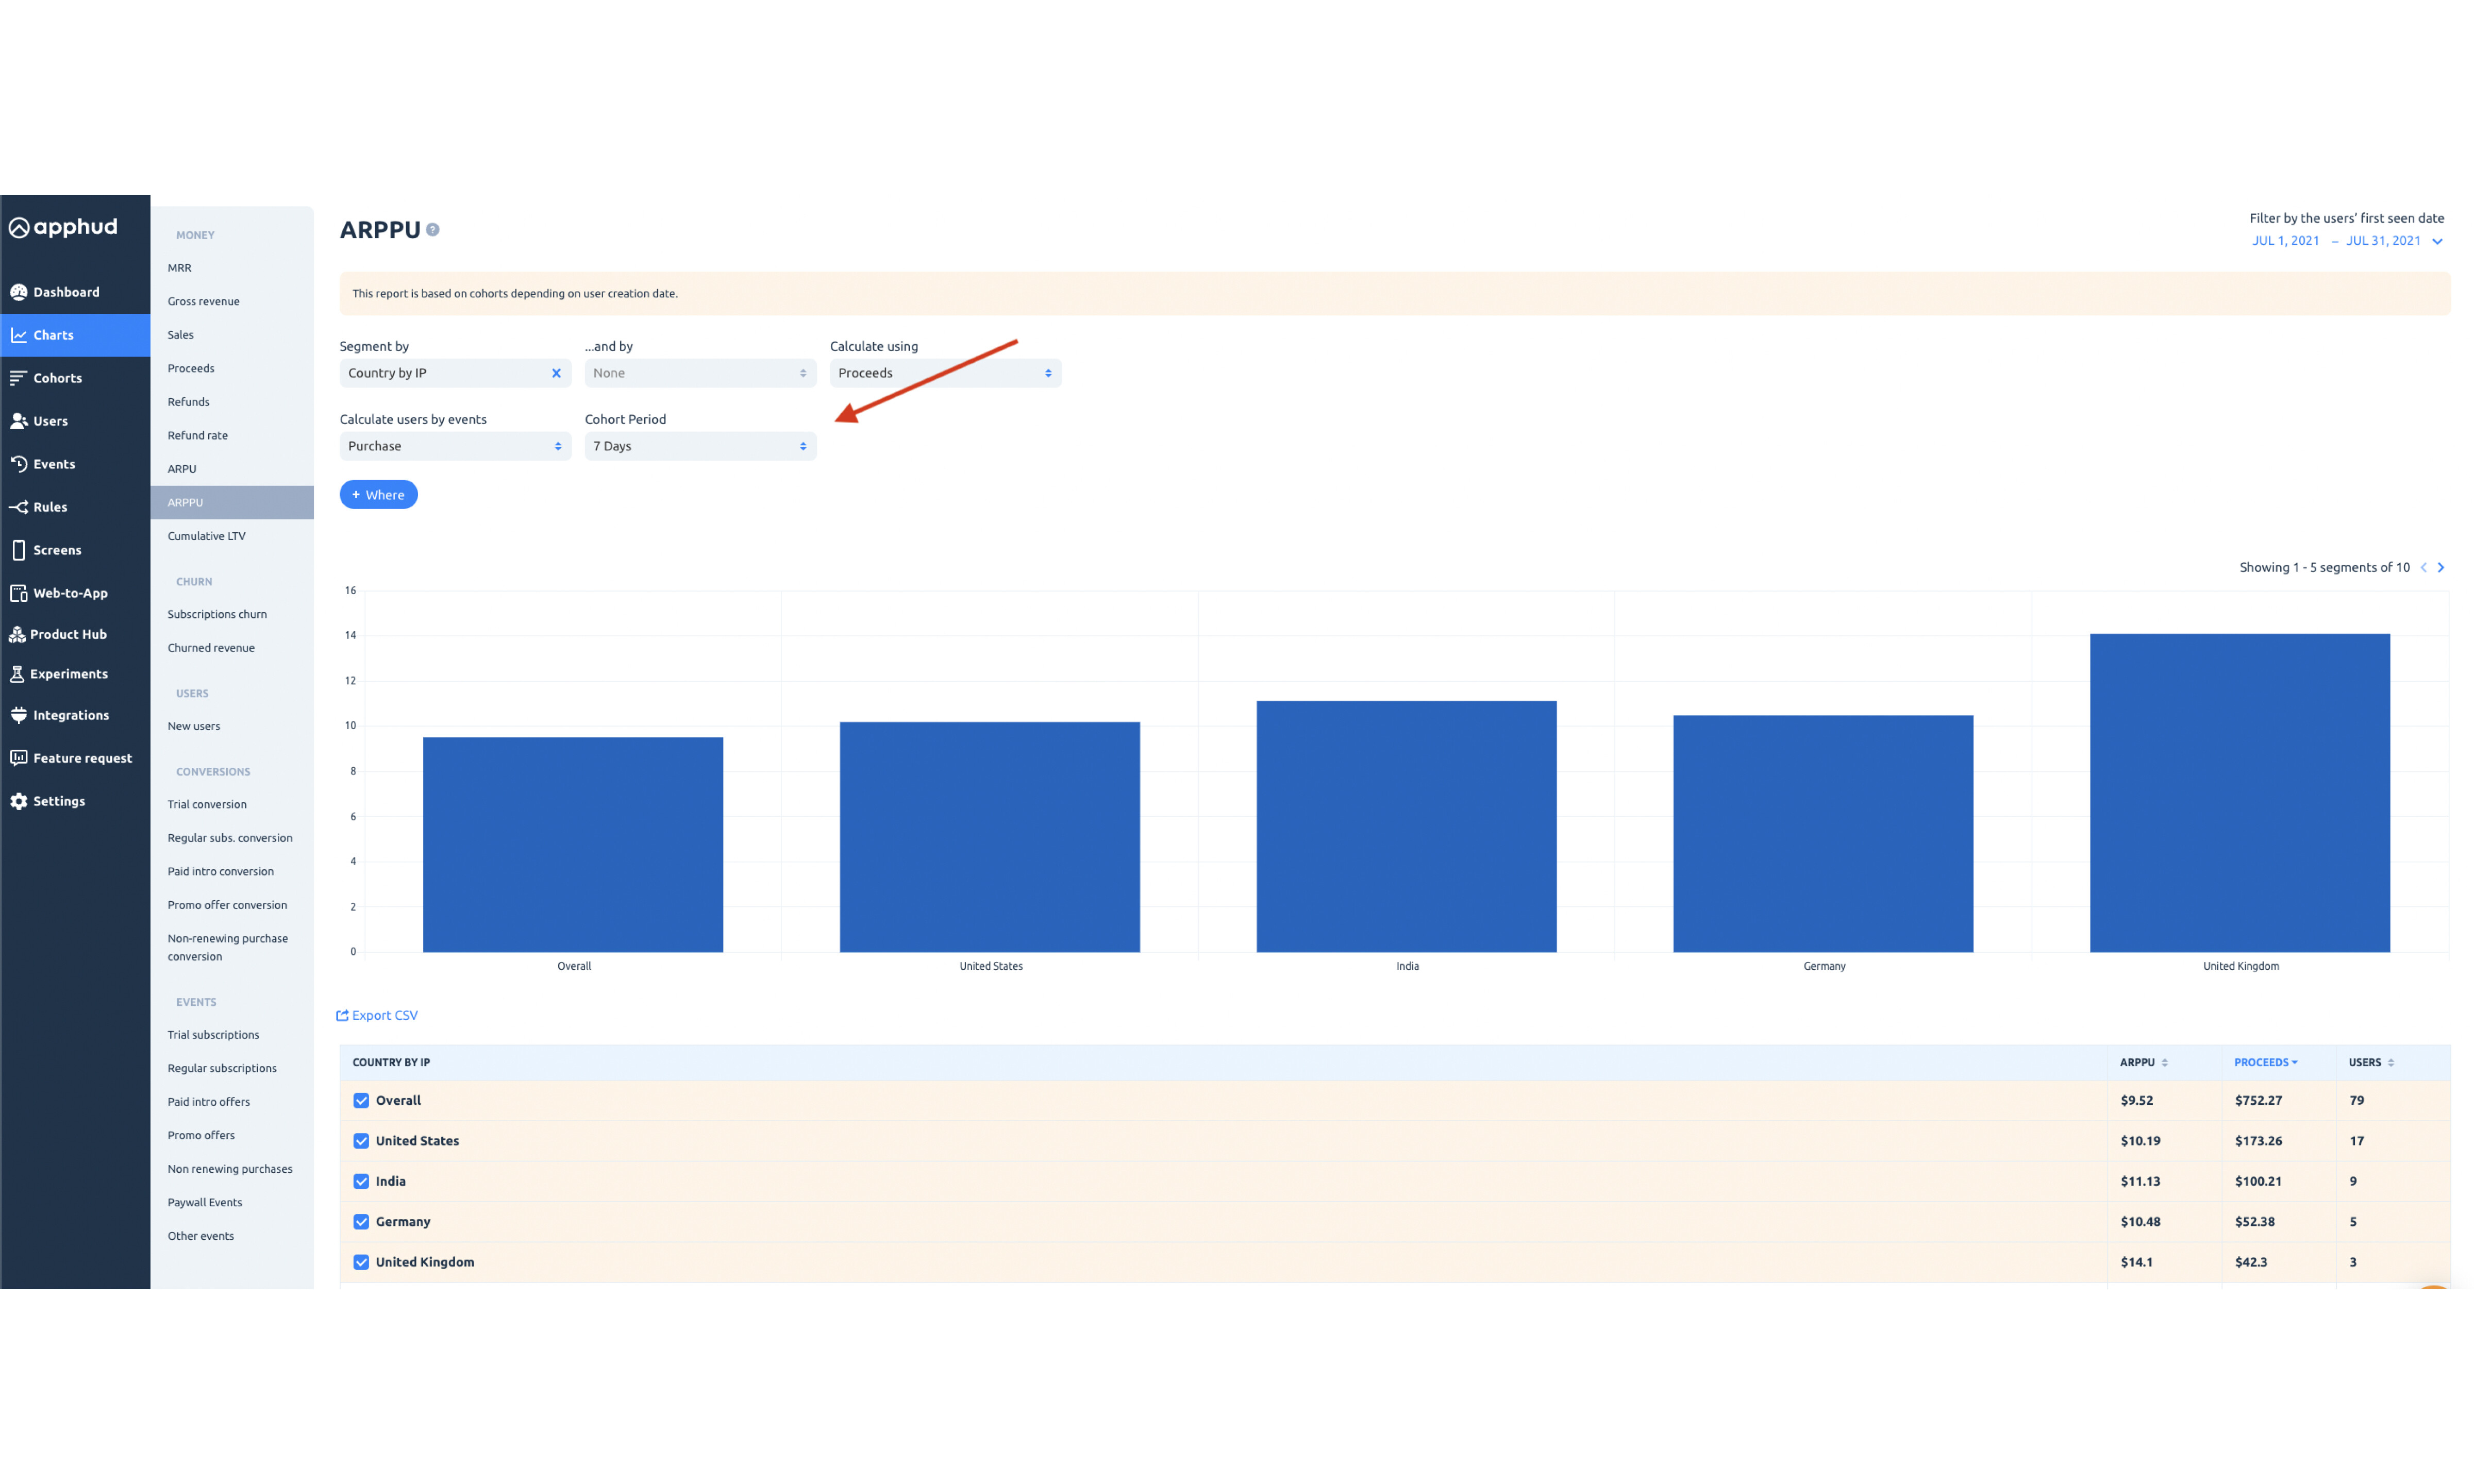 ARPPU grouped by countries for the 7th day's cohort, Apphud ARPPU chart
 ARPPU grouped by countries for the 180th day's cohort, Apphud ARPPU chart
When we change the cohort period, we see that the list of the most profitable countries changes. It is crucial to evaluate your application data based on the app specifics, frequency of payments, etc. Looking at the data from different angles is critical because it expands your view and allows you to make the right decisions.
ARPPU analysis for the Nth day is a good example of how to use your data in the right way. Moreover, Apphud allows you to segment cohorts by day/week/month/quarter/year, paywall, platform, device, promo offer, product, gender, ad campaign, and more.
This is a case based on historical data but it is important that by breaking down the overall cohort in more detail we can find useful insights.
Conclusion
In Apphud, we understand how app revenue analytics is important for your business growth. That’s why data accuracy is our priority. Our platform provides the most accurate app revenue data to provide you with actionable insights. ARPPU for the Nth day analysis demonstrates how you can use Apphud's wide array of features to understand your audience, launch experiments, and test hypotheses. Sign up for Apphud for free and try it now!


