

Business Story: How Apphud achieved 99.9% accuracy on app revenue tracking
Until recently, the limit of data accuracy compared to Apple and Google revenue charts seemed to be around 85-95% among all competing services. However, the Apphud team was able to raise the bar to the next level.

The way to 99.9%
If you are a SaaS service and provide analytics for your customers, then your data must be accurate. People rely on your numbers and make data-driven decisions.
What does it take to reach such a high level of data accuracy? The full answer will not fit in this article, but let me explain it shortly.
Be a guru of Apple / Google APIs
Apple and Google APIs and as well as Server Notifications aren’t designed for analytics purposes, they are built totally for developers. You have to think of some workarounds, like understanding the date when a subscription was actually renewed, or when a refund was actually charged back to a customer. You have to implement all the scenarios and minor APIs, like reading for price increase consent status, etc.
I personally don’t like both Apple and Google APIs for several reasons:
- Apple’s
verifyReceiptendpoint doesn’t contain charge amounts, as Google does; - Google contains the transaction’s gross revenue, however, it returns only the last order;
- Apple returns the full history of In-App Purchases in the receipt, however, transaction ids are not reliable since they may change in some cases; so you have to use an additional
web_order_line_item_ididentifier; - When a user reactivates a subscription in Google Play, a new purchase token is created, however, Apple’s
original_transaction_iddoesn’t change and the subscription model remains the same; - Google’s purchase token is valid only for 60 days after the subscription’s expiration.
Handle all caveats
In our previous articles, we explained why tracking subscription revenue is challenging and edge cases may occur. These edge cases include refunds, prorated refunds, price increases or decreases, and so on. All these edge cases were covered in Apphud a long time ago.

But the list is not final. There are so many cases that we haven't discussed yet. I bet you haven’t heard that there may be a cancellation of a refund. How is that possible? It may happen when a customer has requested a refund through AppleCare support, and it was approved, but a couple of days later a customer has purchased the subscription again.
In this case, the App Store receipt won’t have a new transaction receipt, but the transaction_id of an existing receipt will increase by 1. And if you go to App Store Connect and view the Refunds chart, you will see that there is a positive number on one of the days. See the screenshot attached.
 Unrefund of a refunded transaction, App Store Connect
Manually calculate taxes
Both Apple and Google don’t share the proceeds amount with the developers. To calculate the correct proceeds value you have to manually deduct Value-Added Taxes from the revenues. Luckily, we are doing that.
 Tax and Proceeds amount of the transactions made in the United Kingdom, Apphud
Use the right exchange rates
Until recently, we have been using OpenExchangeRates service for a couple of years to convert revenue into USD. However, the difference between OpenExchangeRates and Apple’s internal exchange rate may be as high as 5-10%. That is why we switched to our own currency conversion service which is almost identical to Apple’s.
Don’t lose the data
This requires hard work on the backend, SDK, and DevOps engineering. As a result of our hard work, Apphud has reached 99.9% of data matching between Apphud and App Stores on the majority* of connected apps.
*There are still apps though, mostly recently added, with a large amount of anonymous abandoned subscribers, whose store country we don’t know and thus unable to calculate taxes for them. Inability to correctly deduct taxes and use a correct exchange rate leads to data discrepancies, which can be fixed only if a given subscriber successfully restores their purchases, so we re-calculate taxes for all their transactions.
Apphud is the Leader in Accuracy
What are the criterias of data accuracy? Is it comparing total revenues on a monthly, weekly or daily basis? Is it comparing sales or proceeds? Should we compare numbers day-to-day? I guess the answer is clear: all of that.
To better understand what current level of accuracy we provide, we asked one of our clients to add Apphud SDK as well as a couple of competing SDKs to their new app with an equal setup. The task was complete, and the app was successfully released many months ago.
Now it’s time to compare test revenues between Apphud and Apple for two different date ranges. For example, let’s take the 1st week of September and August.
What’s below?
Our client provided us numbers and screenshots of Sales and Proceeds from App Store Connect, Apphud, and competing services. We organized this data into one convenient sheet.
We also calculated proceeds, sales, and average accuracy numbers, the latter one is just an arithmetic mean value.
Test #1. Worldwide
Here is the data for worldwide, without any filters for two date ranges.
 Weekly Sales and Proceeds Data Comparison, Worldwide
 Monthly Sales and Proceeds Data Comparison, Worldwide
*SoT means Source of Truth
You can see that Apphud has 99.9% accuracy in a monthly range and an incredible 100% in a weekly range. What a good start!
Now let’s see the screenshots for the given date ranges to check day-to-day revenues.
 Day-to-day match in proceeds between Apphud and App Store Connect for a weekly date range, Apphud Proceeds
 Day-to-day match in proceeds between Apphud and App Store Connect for a weekly date range, App Store Connect Proceeds
Now let’s take a look at monthly charts:
 Day-to-day match in proceeds between Apphud and App Store Connect for a monthly date range, Apphud Proceeds
 Day-to-day match in proceeds between Apphud and App Store Connect for a monthly date range, AppStore Connect Proceeds
The discrepancy for monthly proceeds charts is $1 which is just 0.01% of total proceeds revenue!
Test #2. United States
As you may know, in-app purchase prices in the US are tax exclusive, and no currency conversion is required, so sales and proceeds should totally match.
Here are the results for the United States:
 Weekly Sales and Proceeds Data Comparison, USA
 Monthly Sales and Proceeds Data Comparison, USA
On the table above you can see that Apphud has also 99.9% accuracy on monthly proceeds and a perfect 100% match on a weekly range. Isn’t that amazing?
Not it’s time to validate the numbers with the screenshots:
 Day-to-day match in proceeds between Apphud and App Store Connect for a weekly date range in the US, Apphud Proceeds
 Day-to-day match in proceeds between Apphud and App Store Connect for a weekly date range in the US, App Store Connect Proceeds
As you can see, charts match not only in total revenue but also day-to-day.
 Day-to-day match in proceeds between Apphud and App Store Connect for a monthly date range in the US, Apphud Proceeds
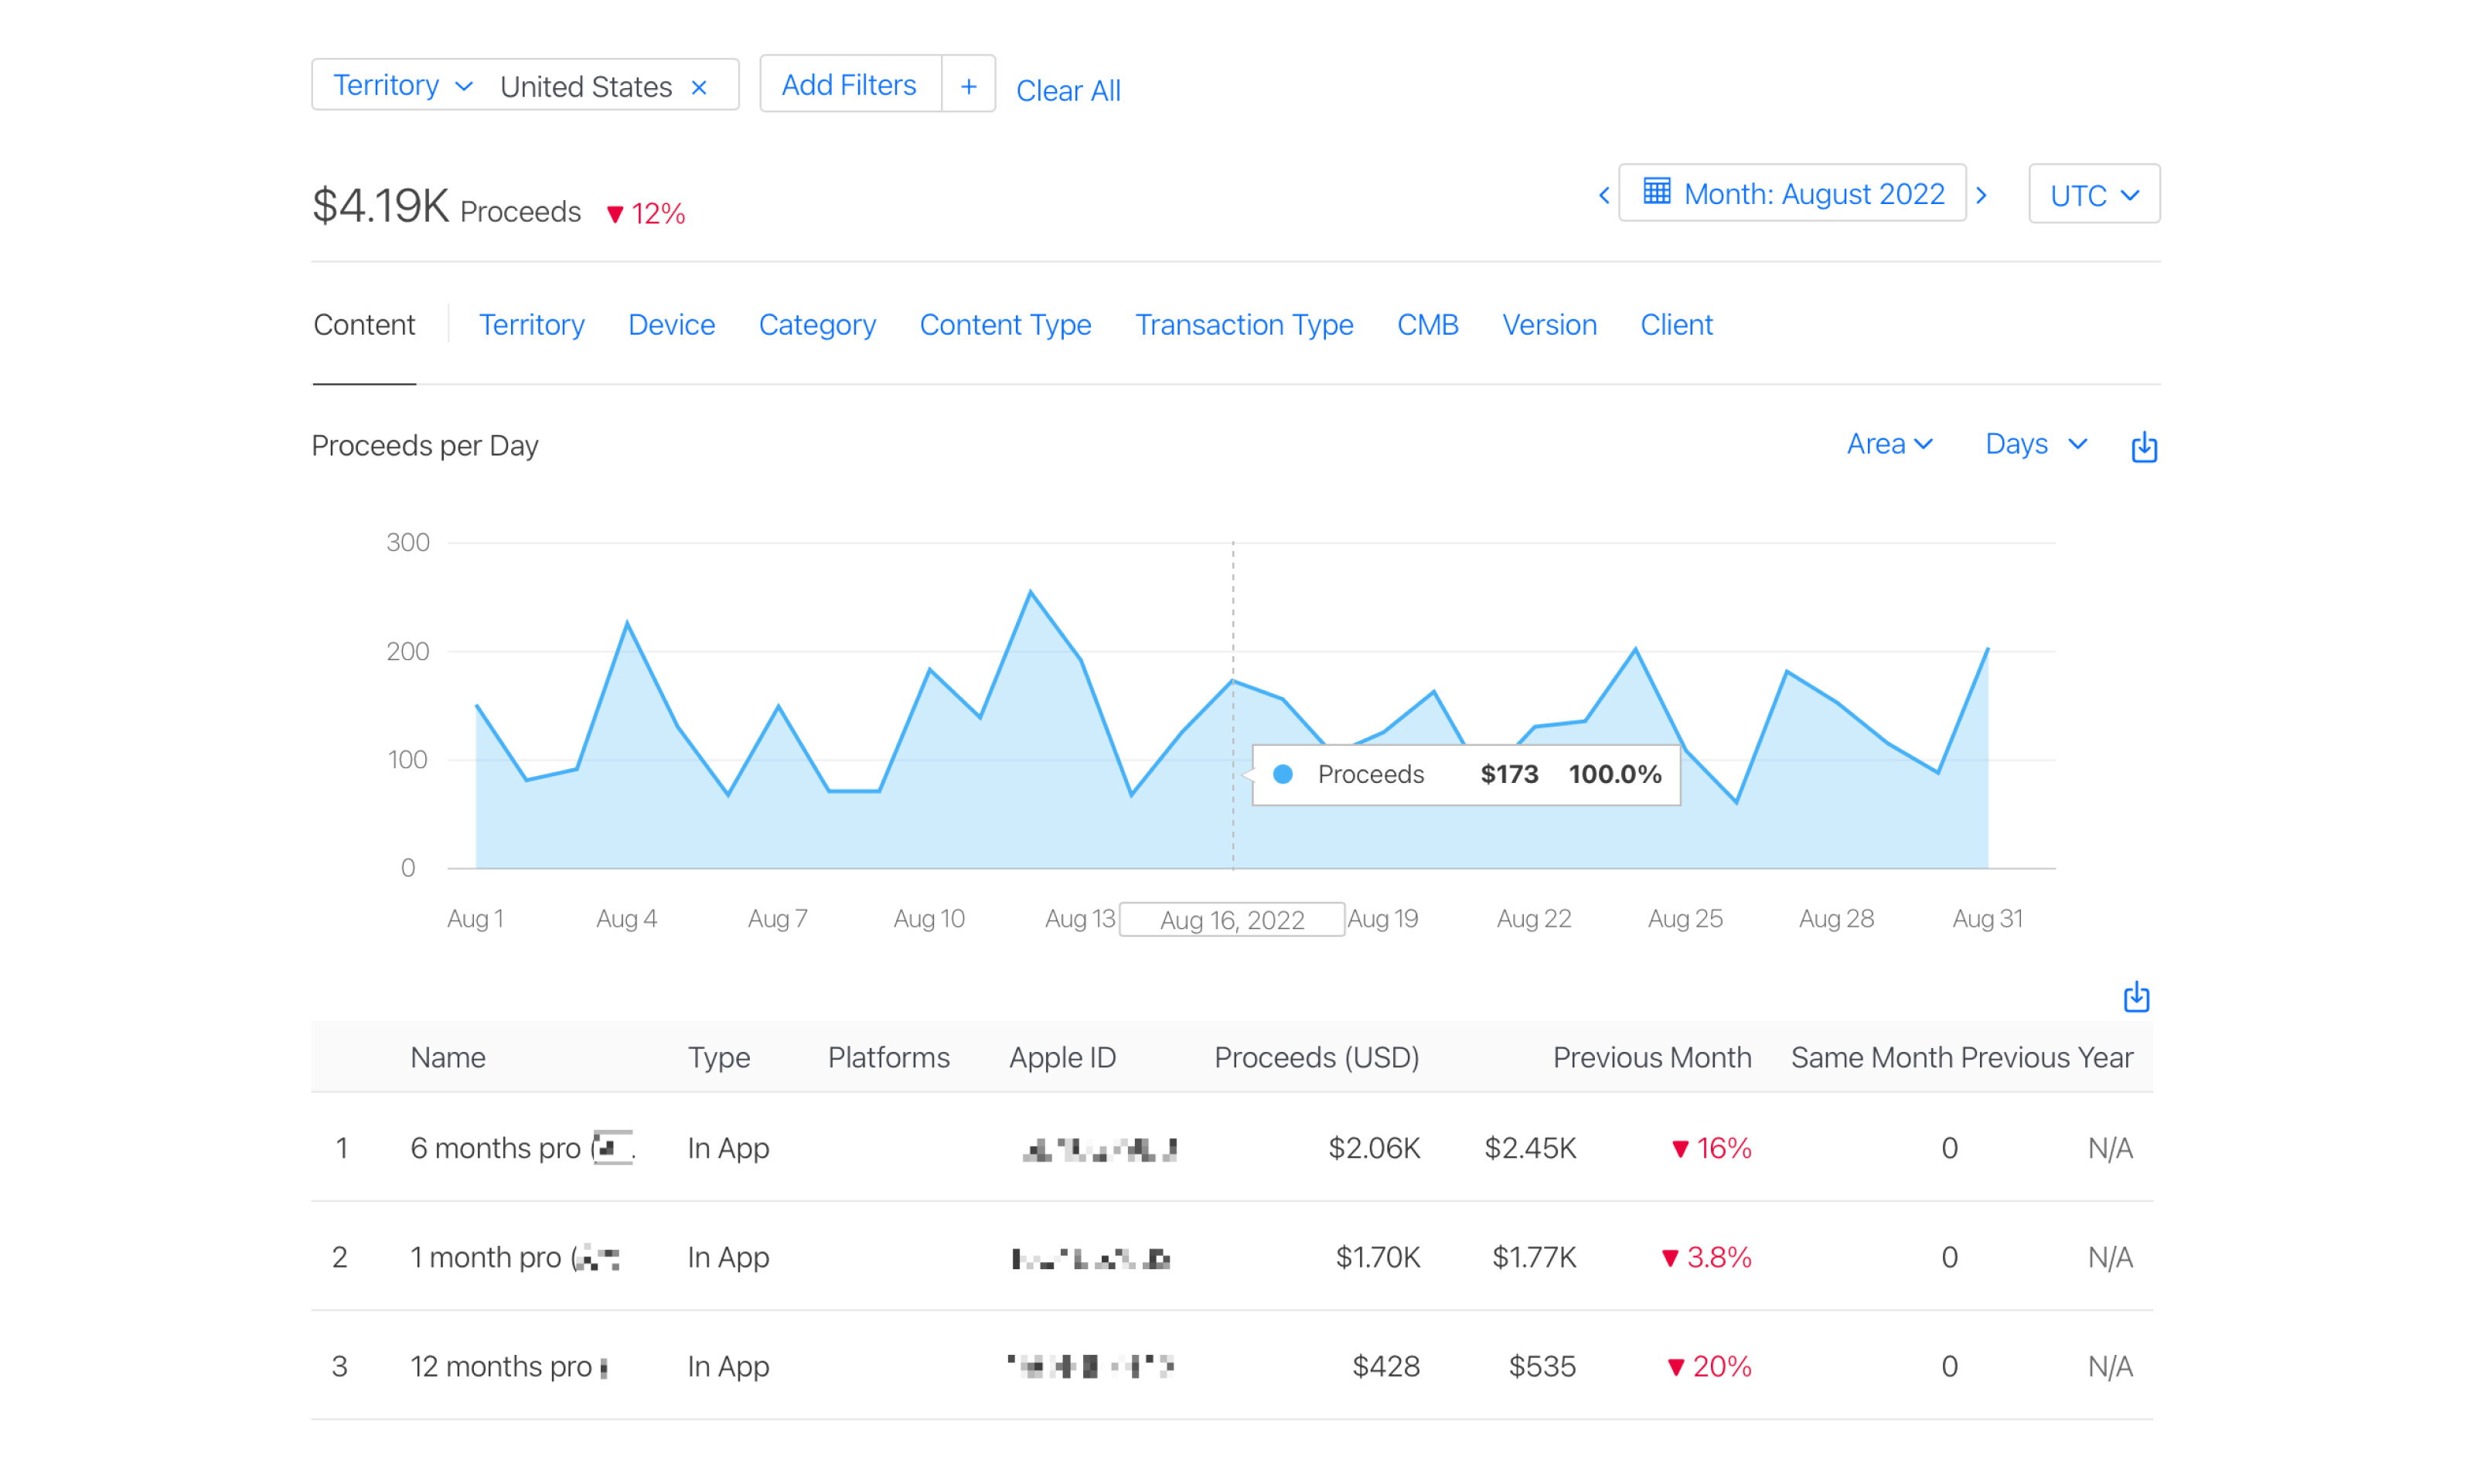 Day-to-day match in proceeds between Apphud and App Store Connect for a monthly date range in the US, App Store Connect Proceeds
The data discrepancy for the monthly proceeds charts in the US is just $4, which is less than 0.1%!
Let’s calculate the total average which is the arithmetical mean of previous average values.
 Total Sales and Proceeds Data Comparison
To summarize, Apphud provides best in class revenue numbers in both monthly or weekly date ranges, in the US or Worldwide, sales and proceeds.
What about Google Play?
It’s easier to make Sales revenues totally match with Google Play. However, in case of proceeds you have to deduct taxes as well. And that’s what we do!
Unfortunately, there is no Proceeds chart in Google Play Console, it’s only Gross. And even the gross revenue chart can’t be compared with Apphud, because Google includes taxes to gross charts for countries with tax-exclusive prices, like the US. Let’s compare an individual order:
 Tax amount matches on a certain Google Play transaction made in the United Kingdom
On the screenshot above you can see that taxes are correctly calculated for a given order.
Why need 99.9%?
Some people may argue that it doesn’t really matter what accuracy you provide: 95% or 99%, since it doesn’t actually help you to earn money. They say that estimated revenue numbers are enough to make data driven decisions.
This may be partially true. But why do we strive for perfection so much? Because it’s our philosophy. The whole service, including Integrations or Experiments, must work super accurately. Otherwise, people won’t trust your service.
Even though Integrations accuracy is another story, let’s see one quick comparison between Apphud and Amplitude.
Amplitude Integration Accuracy
 Paywall events data, Apphud
  Paywall events data, Amplitude
On the screenshots above you can see that in August 7061 'Paywall Checkout Initiated' events were created in Apphud. Amplitude shows 7063 Events. These two events, probably, are related to user merging, which makes sense, because Apphud has lower numbers. We can’t delete data in Amplitude, this is the reason why these two events appeared. So total accuracy is 99.97%.
Conclusion
With this research, we wanted to emphasize why data accuracy is important for your business. Decisions that boost app revenue are based on the data. Apphud is here to make you confident about which next step is the best. Sign up for free and get the most accurate insights!


